


How to Analyze a Company’s Financial Statements
A company can tell investors a great story. Financial statements show whether the numbers support it. Revenue may be growing, management may be talking about a huge market opportunity, and a new product may be generating headlines. But investors need to look beyond the story.
Is the company actually profitable? Is it generating cash? How much debt does it have? Are margins improving? And is the business financially stronger than it was a few years ago?
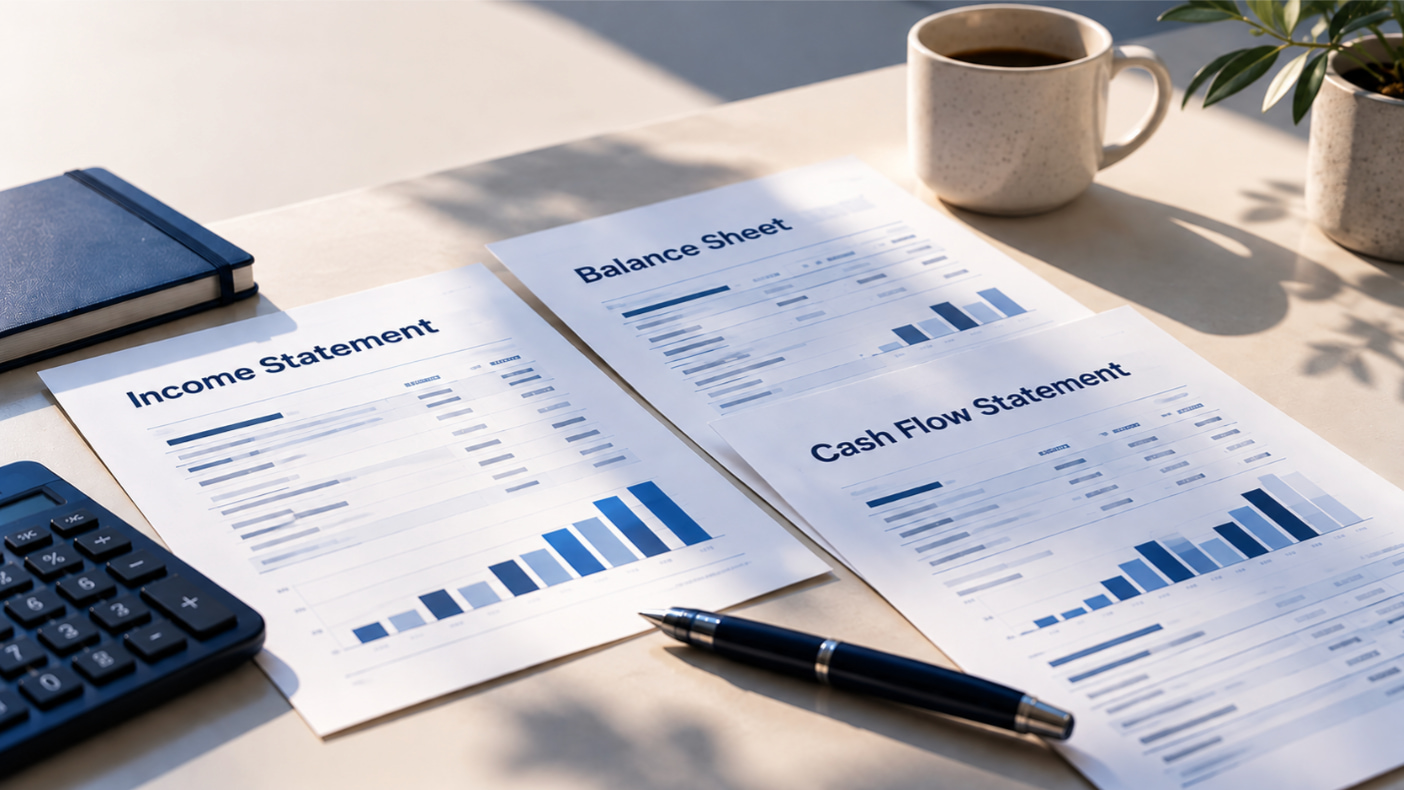
Fortunately, you don't need to be an accountant to find the answers. Most investors can learn a great deal from three documents: the income statement, balance sheet, and cash flow statement. Together, they provide a surprisingly clear picture of how a business is performing.
The Income Statement: Is the Business Making Money?
The income statement shows how much money a company generated during a period, what it spent, and how much profit remained. At its simplest:
Revenue - Expenses - Profit
Suppose a company reports:
The interesting part isn't simply that revenue increased. Revenue grew 50% over two years, while net income more than doubled. That suggests the company became more profitable as it grew.
Revenue tells how much the company generates from selling its products or services. However, don't stop at “Is revenue growing?” Ask why. Is the company selling more products? Raising prices? Entering new markets? Or did revenue jump because it acquired another business? Consistent organic growth generally tells a different story from a one-time increase.
Margins show how efficiently the company converts revenue into profit. If a business generates $1 billion in revenue and $100 million in net income, its net profit margin is:
$100M ÷ $1B = 10%
If revenue later reaches $1.5 billion and profit rises to $225 million, the margin becomes 15%. The company isn't simply getting bigger. It's keeping more profit from every dollar of sales. Improving margins can indicate greater efficiency, scale, or pricing power. Falling margins can signal rising costs or increasing competition.
The Balance Sheet: Is the Company Financially Healthy?
While the income statement shows performance over a period, the balance sheet provides a snapshot of the company's financial position. It follows a basic equation:
Assets = Liabilities + Shareholders’ Equity
In practical terms, investors want to understand what the company owns and what it owes. Consider two companies that each generate $200 million in annual profit.
Company A has $1 billion in cash and $200 million in debt.
Company B has $100 million in cash and $2 billion in debt.
Same profit. Very different financial situations. Company B may have less flexibility if earnings decline or borrowing costs increase. Debt isn't automatically bad. Companies regularly borrow to finance expansion and acquisitions. The important question is whether the business generates enough earnings and cash flow to comfortably manage that debt.
Investors should also look at short-term liquidity. For example, the current ratio compares current assets with current liabilities: Current Assets ÷ Current Liabilities. A ratio above 1 means current assets exceed current liabilities, although what counts as a healthy level varies considerably between industries.
The Cash Flow Statement: Follow the Money
A company can report accounting profits without generating much cash. That's why the cash flow statement is so useful. It shows how cash moves through three areas:
Operating activities - cash generated by the core business.
Investing activities - spending on equipment, property, acquisitions, and investments.
Financing activities - borrowing, debt repayment, dividends, share issuance, and buybacks.
For investors, operating cash flow is particularly important because it helps show whether the company's actual operations are generating cash. Another useful metric is free cash flow (FCF). In simplified form:
FCF = Operating Cash Flow − Capital Expenditures
Suppose a company generates $500 million in operating cash flow and spends $150 million on capital expenditures. Its free cash flow is approximately: $500M − $150M = $350M
That cash gives management options: reinvest in the business, reduce debt, make acquisitions, repurchase shares, or pay dividends. Consistent free cash flow can therefore be an important sign of financial strength.
Key Metrics Worth Watching
You don't need dozens of financial ratios to analyze a company. A few key metrics can provide plenty of useful context. Revenue growth shows whether the business is expanding. Look at several years rather than one quarter. Profit margins show how much of each dollar of revenue becomes profit. Pay attention to whether margins are improving or deteriorating.
Free cash flow helps determine whether reported profits translate into actual cash. Debt levels show how dependent the company is on borrowed capital. Earnings per share (EPS) tells you how much profit is attributable to each share. P/E ratio compares share price with earnings. For example, a $100 stock earning $5 per share has a P/E of 20.
However, remember: no single metric tells you whether a company is a good investment. A low P/E isn't automatically cheap. High revenue growth isn't automatically good if the company is losing more money every year. Numbers need context.
Financial Red Flags
Some of the most useful information in financial statements comes from numbers that don't quite fit the company's story. For example:
Revenue rises, but cash flow falls. The company appears to be growing, but that growth isn't translating into cash.
Debt grows much faster than earnings. Borrowing may be financing expansion, but it could eventually become difficult to manage.
Margins keep declining. Costs may be rising or the company may be losing pricing power.
The number of shares increases rapidly. New share issuance can dilute existing investors, meaning each share represents a smaller percentage of the company.
None of these automatically makes a company a bad investment. However, they should make you ask: Why is this happening? That's one of the most valuable habits in financial analysis.
Conclusion
Financial statements aren't three unrelated spreadsheets. They tell different parts of the same story. The income statement shows whether the business is growing and profitable. The balance sheet shows what it owns, what it owes, and how financially resilient it is. The cash flow statement shows whether accounting profits are translating into real cash.
You don't need to analyze every line. Start with revenue, margins, profit, cash flow, debt, and share count. Compare several years rather than relying on a single quarter. And whenever something changes significantly, investigate why.
Financial analysis isn't about memorizing formulas. It's about learning to recognize the difference between a company that looks impressive and one whose underlying numbers actually support the story. Once you learn to do that, financial statements stop looking like pages of numbers. They start looking like a business you can understand.